


By Rick Schuman, VP, Public Sector Americas (rick@inrix.com)
This is the sixth edition of a weekly review of changes in road traffic demand in the United States from the COVID-19 virus spread and our collective response.[1] We will endeavor to publish this Synopsis every Monday for the foreseeable future, providing results through Friday of the previous week. For those interested in detailed information with daily updates, we have introduced the INRIX Traffic Volume Trends Dashboard.
Key Findings
- Travel is rebounding, across the country and in all vehicle types
- Nationwide personal travel back levels last recorded on Friday, March 27th, four weeks ago
- Nationally, when compared to typical travel,[2] Week 6 (Saturday, April 18 – Friday, April 24) saw:
- Personal travel down 41% vs. 46% in Week 5, increasing daily since April 15th
- Long haul truck travel down 9% vs. 13% in Week 5, increasing daily since April 16th
- Local fleets in Metro Areas down 7% vs. 9% in Week 5
- Travel decline leaders in Week 6:
- Statewide Personal Travel: New Jersey, down 58% vs. 60% last week
- Statewide Long Haul Truck Travel: Michigan, down 35% vs. 37% last week
- Metro Area Personal Travel: New York City, down 60% vs. 62% last week
- Metro Area Local Fleets: Detroit, down 44% vs. 48% last week
Background
Our incoming data sources (The ‘INRIX Fleet’) provides anonymous speed/location reporting to us in real-time and generates over 100 million trips, traveling over 1 billion total miles per day across the US. The INRIX Fleet provides information about all roads in the national network, not just major roads and spans the full range of vehicle types: consumer vehicles, local fleets, long haul trucks.
We have re-purposed our INRIX Trips metadata – with only a 48-hour lag – to generate relevant summary level information about traffic demand.[3] In this extraordinary time, we hope that this information will be useful to policy makers and the public. We look forward to the week, hopefully soon, when we can report on congestion and volume growth – as this will be a sure sign of recovery.
Synopsis
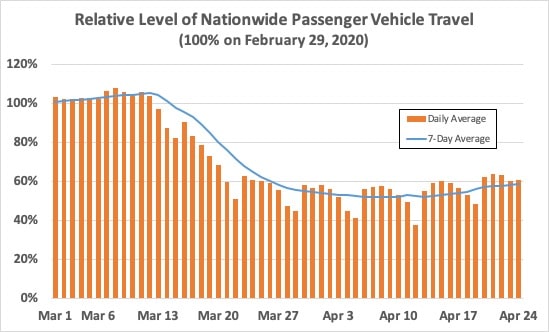
It has been six full weeks since travel began its noticeable decline nationwide. Figure 1 shows the relative change in passenger vehicle travel from March 1, relative to the comparable day of the week during the control week of February 22 – 28, 2020. Figure 1 also includes a weekly rolling average. Passenger travel is clearly trending upwards, down 41% on Friday, April 24th, compared to 46% the previous Friday and 48% on April 9th the low point to date. The rolling average was last at 41% on Friday, March 27th, four weeks ago.
Figure 1
State Level Passenger Travel increased in every state compared to last week. Rhode Island had the lowest increase (0.5%), Wyoming had the highest (16%). Seven states (Wyoming, South Dakota, Montana, Nebraska, Iowa, Minnesota, and Colorado) all saw week-ver-week increases of 10% or more. Figure 2 shows each state’s weekly rolling average on April 24th in blue and the maximum drop at any point from March 1st in orange.
All states have recovered at least 5% from their maximum weekly rolling average reduction, with 17 states recovering 10% or more. Minnesota has had the largest recovery from its maximum reduction of 19%, from 54% to 35%. The date when weekly rolling average reduction peaked varied widely by state. Illinois had the first peak, the week ending March 28th. Colorado had the last peak, the week ending April 18th. 14 states peaked in Week 3 (March 28 – April 3), 24 states in Week 4 (April 4-10), 11 states in Week 5 (April 11-17), and one state in Week 6 (April 18-24).
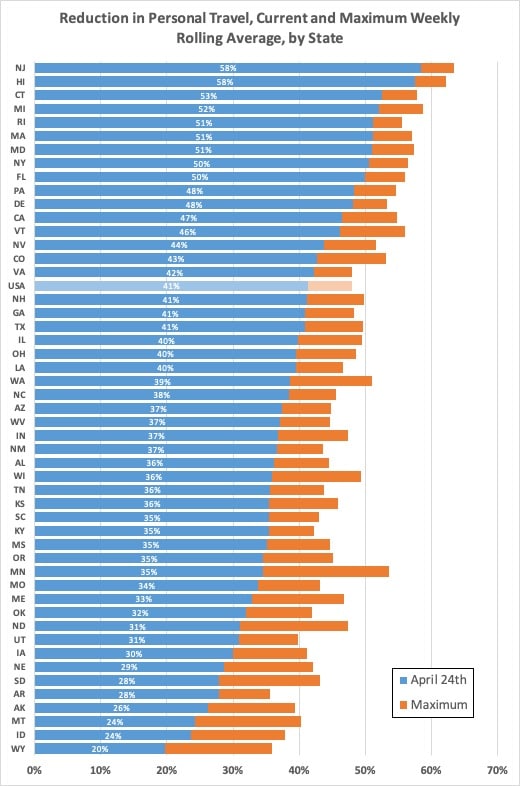
Figure 2
Nationwide Long Haul Truck travel reversed declines in Week 6, down 9%, compared to 13% last week. As highlighted in last week’s Synopsis, Easter weekend appeared impact Week 5, as the weekly average on April 24th was last recorded on April 10th, just prior to Easter weekend. All but two states increased truck travel from Week 5, and even those states (Kansas and New Hampshire) saw a drop of less than 1% week-over-week. Two states had week-over-week increases above 10%, Wyoming (13%) and Nebraska (12%).
Through Week 6, only Kansas is at its maximum reduction in truck travel, down 6%. 16 states have overall reductions in truck travel exceeding 10%, still led by Michigan (35%) and Texas (18%). Six states, led by Wyoming, have increased truck travel compared to the control week.
Metropolitan Area[4] personal travel continued to increased overall this week, with all 98 metropolitan areas we track in this Synopsis increasing week over week. Four metropolitan areas saw weekly increases of more than 10%. All areas still have declines in personal travel of over 30% compared to the control week. 16 areas still have declines over 50%, 54 areas have declines in the 40%’s and 29 have declines in the 30%’s.
Noteworthy Statistics:
- Most Overall Reduction in Personal Travel Compared in Week 6 Compared to the Control Week:
- New York (60%), Orlando (58%), Detroit (56%), San Francisco (56%), Miami (55%)
- Least Overall Reduction in Personal Travel Compared in Week 6 Compared to the Control Week:
- Boise (31%), Little Rock (31%), Spokane (32%), Salt Lake City (33%), Visalia, CA (33%)
- Largest Increases in Travel in Week 6 as Compared to Week 5:
- Omaha (12%), Des Moines (11%), Denver (11%), Colorado Springs (10%), Minneapolis (9%)
- Still Within 5% of Peak Reduction (% is Week 6 Overall Reduction):
- Orlando (58%), Philadelphia (55%), Washington, DC (53%), Sarasota, FL (52%), Tampa (49%)
- Largest Increases from Peak Reduction (% is Increase from Peak Reduction to Week 6):
- Minneapolis (17%), Spokane (15%), Fort Wayne (14%), Salinas, CA (13%), Boise (12%)
- 90 of the 98 Areas had increased local fleet traffic as well.
A reminder again this week on seasonal adjustments. Ordinarily at this time of year, travel would be increasing significantly in the spring as compared to the winter months.[5] Double digit increases in travel for April as compared to February would be expected. Obviously this is no ordinary year.
[1] Previous Issues can be found on the INRIX Blog site
[2] Given the day of week pattern of travel demand, we compare a given day and area to the same day/area in a previous week, and we are using the week commencing Saturday, February 22, 2020 as our ‘control week’
[3] Metadata used is total trip distance of all INRIX Trips originating in the country/state/region each day
[4] INRIX has established 98 metropolitan area geographies for internal purposes; these are the areas used in this analysis
[5] https://www.bts.gov/explore-topics-and-geography/topics/seasonally-adjusting-vehicle-miles-traveled